A spectrogram to die for
(some) Fundamentals of acoustics

Before we move on to the final article in the PTSQ Series, I think it might be useful to go over some basic concepts of acoustics, most notably to understand what these are about:

As you might have noticed, I love to use spectrograms to describe pretty much any noise I talk about. While they’re not the only way to show data, they are information dense and thus might be a bit difficult to unpack the first time you see one: I remember staring intently for a few minutes the first time I saw one and it took a few mores spectrograms for me to familiarize myself with these.
We’ll see in a minute what they represent and how they’re made but let’s start at the beginning.
There are two fundamental aspects to remember when talking about sound, the sound pressure level and the frequency. Let’s start with the former.
There are many articles and videos talking about acoustics, so the objective is not to go through a full course here, just covering what is needed and perhaps some more.
Sound Pressure Level (SPL):
While I do want to cover psycho-acoustics in future posts, as I am pretty passionate about it, for the moment it is just important to understand that the physical phenomenon responsible for noise is quick variations in pressure and by quick I mean 20Hz to 20,000Hz (for the youngest of us).
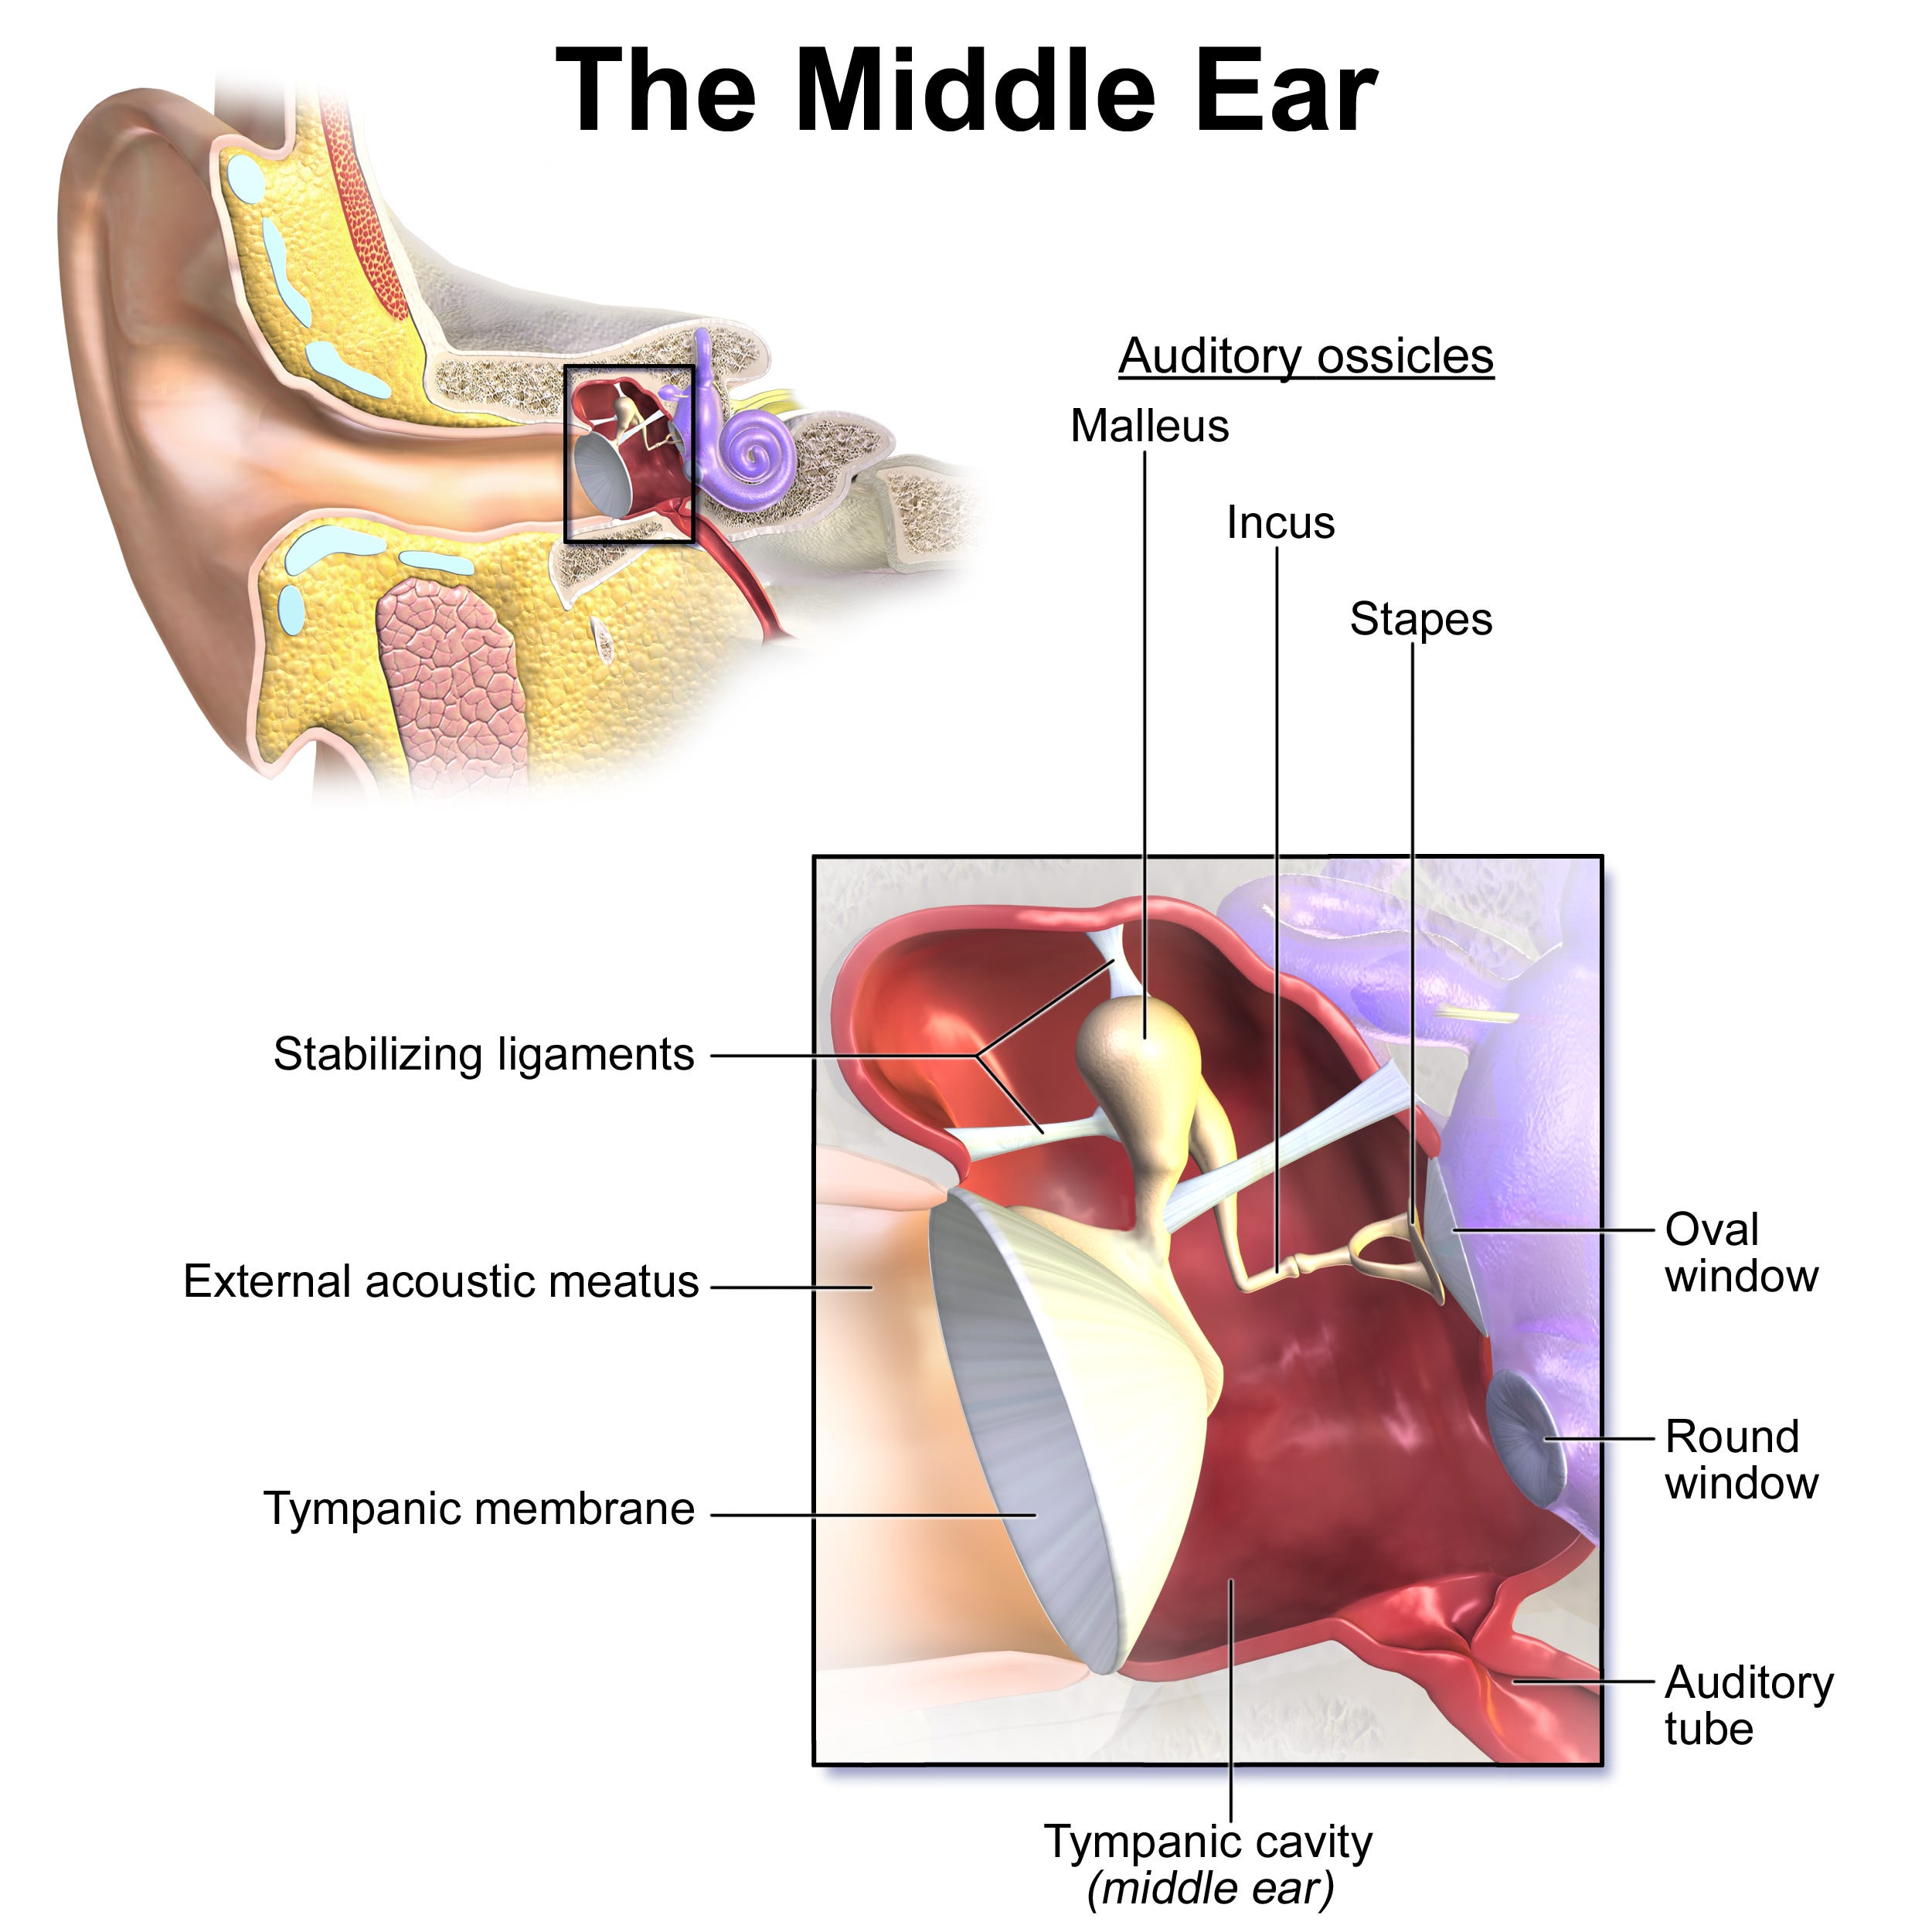
Effectively, the first interface between noise and our perception of it is the eardrum (the tympanic membrane below):
When talking about pressure, we differentiate between static and dynamic pressure.
Static pressure is more often referred to as atmospheric or ambient pressure, depending essentially on altitude and meteorological conditions. For reference, at sea level it is equal to 101,325 Pa (Pascals) = 1 atm (atmosphere) and is mainly due to the hydro-static pressure, i.e. the force (“weight”) the air directly above in the atmosphere exerts downwards. It varies slowly in time but will make you ears “pop” if it suddenly changes, thanks to the active opening of your Eustachian tube and is ultimately not responsible for the sounds you hear.
The dynamic pressure is. More precisely, tiny variations of pressure above and below the ambient pressure is responsible for exciting your eardrums, which is then interpreted as sound by your brain (If a tree falls in a forest and no one is around to hear it, does it make a sound?).
These pressure variations are perceptible by humans from as low as 20 micropascals, i.e. 0.00002Pa (which is 0dB) and will start doing some permanent damage to your hearing if you’re exposed to more than a short bust of 10Pa (which is 114dB).
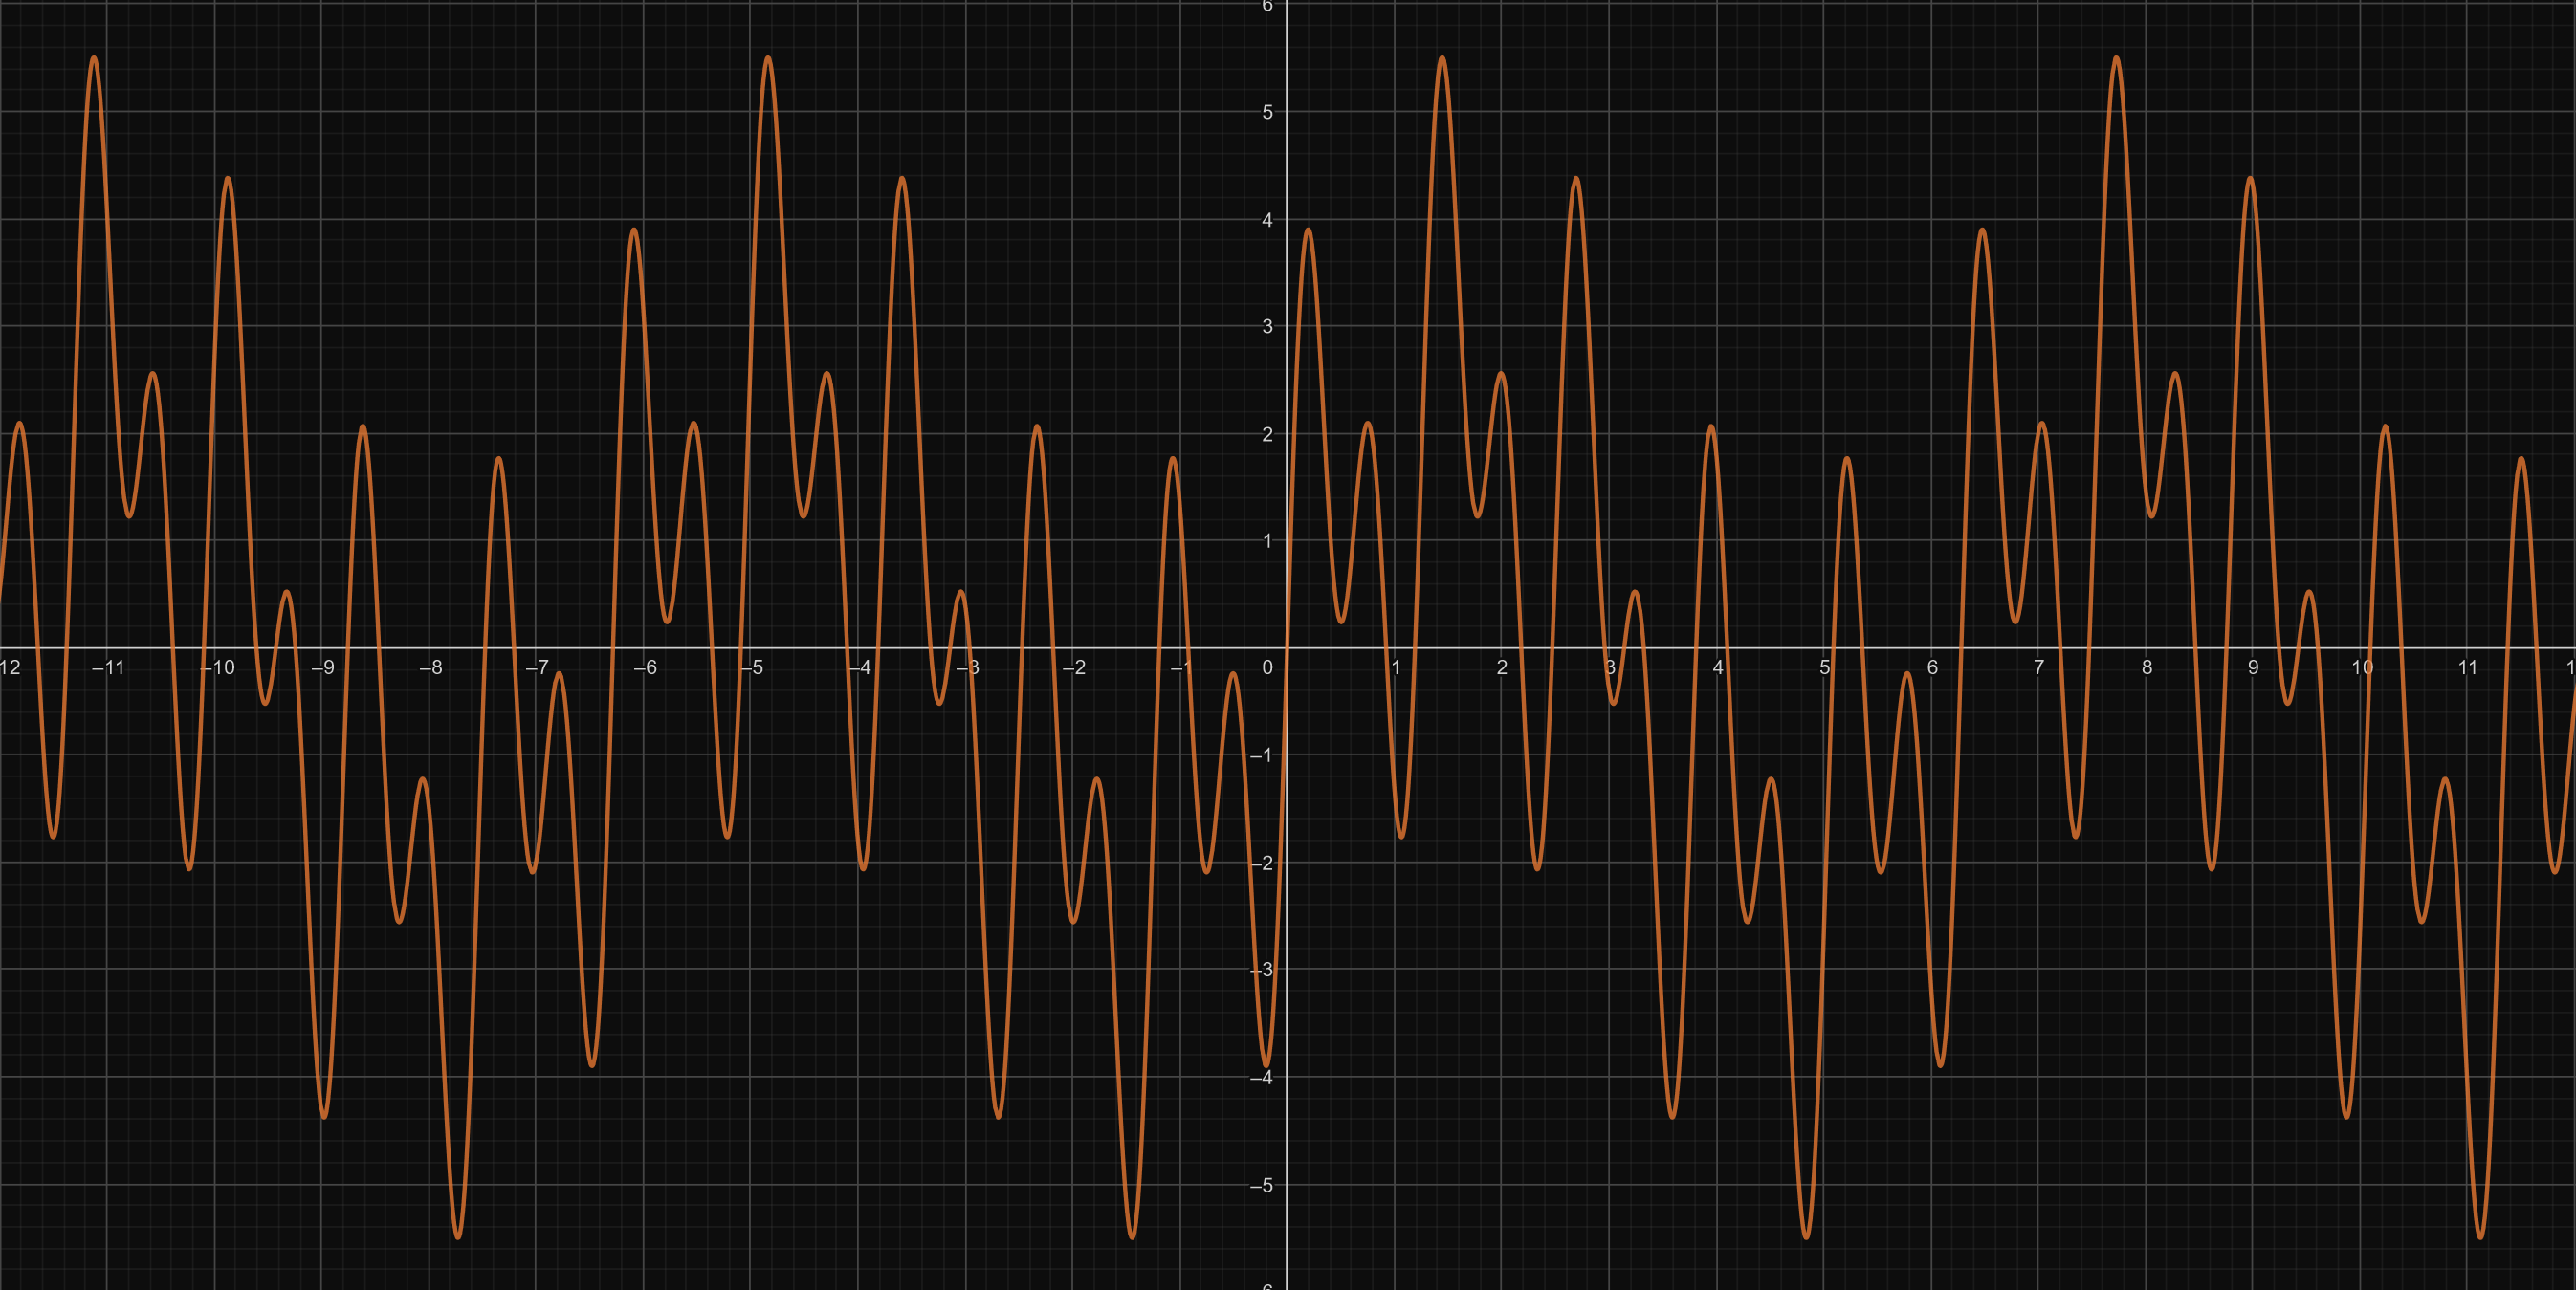
When we want to look at recorded noise, we are often offered this classical representation:

What this shows is the amplitude variation of pressure in one location, precisely where your eardrum or a microphone is located. A microphone, very simply, is a membrane that vibrates because of variations in pressure and the membrane’s displacement is converted into a voltage, which can be done through a variety of techniques, pretty much like our eardrum so.
This representation can lead to some confusion as to how those sound waves travel in air, because they don’t oscillate up and down (as a transverse wave would) but along the direction of travel, as such:

In the illustration above, the sound-wave travels from left to right. The static pressure is represented by the undisturbed square, zones of compression (i.e. the peaks on the classical representation) are where the vertical lines (supposed to represent molecules of air) are closer from each other and zones of rarefaction (i.e. the dips on the classical representation) are where the vertical lines are further away from each other. The higher the amplitude of that sound-wave, the more the compression-rarefaction effect will be pronounced (molecules getting squished even closer and then even further), meaning that your eardrum (which are only a denser arrangement of different molecules) will be push-pulled more strongly, signal that your brain will interpret as a louder sound.
And that’s about what we need to know about amplitude for now, excluding the psycho-acoustic aspect of it.
The second fundamental aspect of sound is frequency.
Frequency:
Let’s look at three examples of sound-waves with different frequencies:
As you can see, if we consider the x-axis being time, these three sound-waves vary more or less slowly in time. The main difference is their period, which is characterized by the time it takes for the sound-wave to repeat itself, i.e. the time between each peak for example.
In this example, T1 is longer than T2 and T2 is longer than T3, i.e. T1>T2>T3.
Frequency (f in Hertz [Hz]) is simply the inverse of the period (T in second [s]): f = 1/T. Meaning that the longer the period, the lower the frequency and vice-versa so in this example we’d get f1<f2<f3.
The lower frequency a human can perceive being 20Hz, this corresponds to a period of 1/20 = 0.05s (not far from your 2nd order of a 4 cylinder idling at 650rpm), while the higher frequency a human can perceive is 20,000Hz, i.e. 1/20000 = 0.00005s (typically from electric motor/components, or extremely high pitched whistling noises from air leaks or wind noise issues but I wouldn’t worry about those at that high a frequency).
Now, one sound-wave can effectively contain a single frequency (such as a pure tone, one of the three examples just above);
A multitude of them (a pure tone and its harmonics, or the three previous examples combined as below):
All the frequencies from 20Hz to 20,000Hz randomly played together (aka white noise):
Now, let’s consider we just recorded a sound and we are interested to know what frequencies it contains, how do we go on about determining these ?
Thanks to the French, again (Cocorico!) and more precisely to Joseph Fourier, we have a mathematical function, the Fourier transform, that allows us to do just that. The theory behind it is incredibly interesting and I highly you do yourself a favor and watch this video from 3Blue1Brown (all his videos for that matter, this guy is seriously good at explaining complex topics such as these) if you want a short introduction.
What this function allows you to do effectively is to extract the frequencies from any periodic signal you can encounter and know their distribution and amplitude.
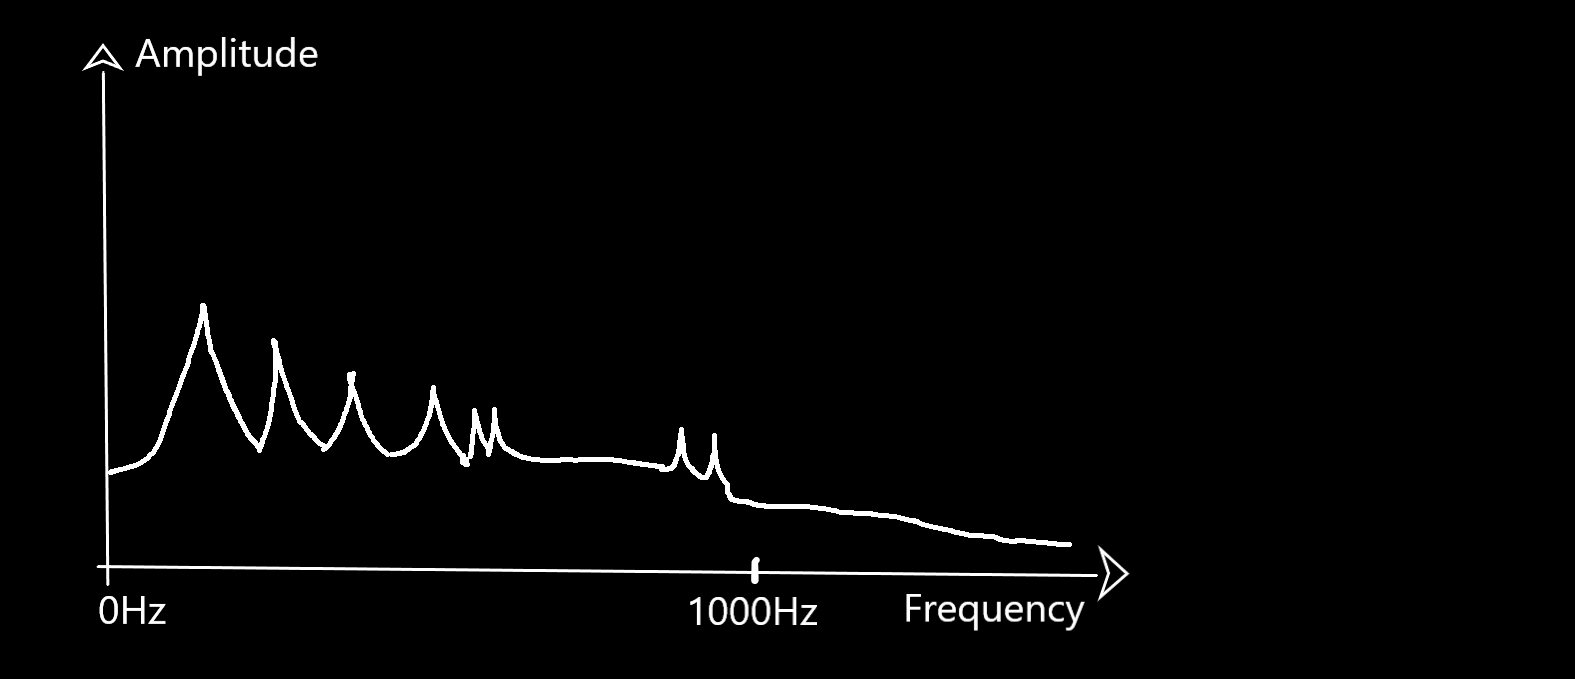
For example, if we were to select a time window of the following signal (our three different sound waves combined) and apply the Fourier transform, we would get the following frequency distribution:

And here we get to the spectrogram part (the Renault 5 Alpine Turbo, AGAIN):

Effectively, a spectrogram is a visual representation of Amplitude (the different colors), Frequency (the vertical axis) and time (the horizontal axis).
If we were to look at one of the vertical slices drawn at the left of this spectrogram (some tiny time windows):

We would get the following frequency distribution (my best approximation):
So you can see that a spectrogram is basically a stack of time windows, piled up one after another in a chronological fashion and when looked at together, it effectively gives us the evolution of the frequency distribution of any sound in function of time.
This is why it is so powerful and useful when looking at sounds that are varying in time, such as powertrain noise. It is also pretty fancy and nice to look at :).
Ok that’s it for this small annex, I hope to be done with the final chapter in the PTSQ series soon, which will be all about how Powertrain Sound Quality is designed, exciting stuff !
Thank you for reading this far, let me know your thoughts and feedback in the comments !
And if you haven’t read those articles yet, have a look at: